Situation
I conducted SQL analysis on ecommerce data from TheLook to provide growth and retention insights to inform optimization decisions during a potential crisis.
Backround
TheLook is an ecommerce clothing retailer anticipating an economic downturn in 2023. To optimize their business, management needs to strategically cut costs in underperforming areas.
TheLook lacks insights into their category growth and customer retention metrics. This data is required to determine which categories have momentum versus which are stagnating. By conducting SQL analysis on their historical transaction data, I can provide data-backed recommendations on where TheLook should double down versus reduce operational resources. Focusing on high-growth categories with loyal customers, while cutting costs in lagging segments, will help TheLook successfully weather the anticipated crisis. My data-driven insights will enable optimization decisions that balance growth opportunities with the need for tighter spending.
Problem Definition
The problem was that TheLook lacked insights into category growth and customer retention trends needed to strategically optimize operations.
Objective
This project demonstrates SQL and BigQuery proficiency through:
- Data retrieval: Extracting insights from large datasets via targeted SQL queries.
- Aggregation: Summarizing complex data using SQL functions.
- Joins: Combining disparate data sources via SQL joins.
- Transformation: Manipulating and formatting data using SQL operations.
Task & Action
| Task | Action | Reason |
|---|---|---|
| Understand business context | Reviewed background details on TheLook’s situation | Identified key optimization goals and constraints |
| Review data dictionary | Studied table schemas and column definitions | Familiarized myself with available data |
| Define analysis goals | Outlined how the data could inform category optimization decisions | Aligned plan to business needs |
| Query category growth | Calculated monthly category growth percentages ordered by time with SQL | Provided trends showing high/low growth categories |
| Analyze growth insights | Identified categories with strongest/weakest growth in past year | Revealed areas to prioritize and cut back |
| Build retention cohorts | Created cohorts based on first purchase date and analyzed retention with SQL | Measured customer loyalty trends by category |
| Synthesize recommendations | Recommended categories to focus on or reduce based on growth and retention insights | Optimized business based on data findings |
Result - Slide Deck
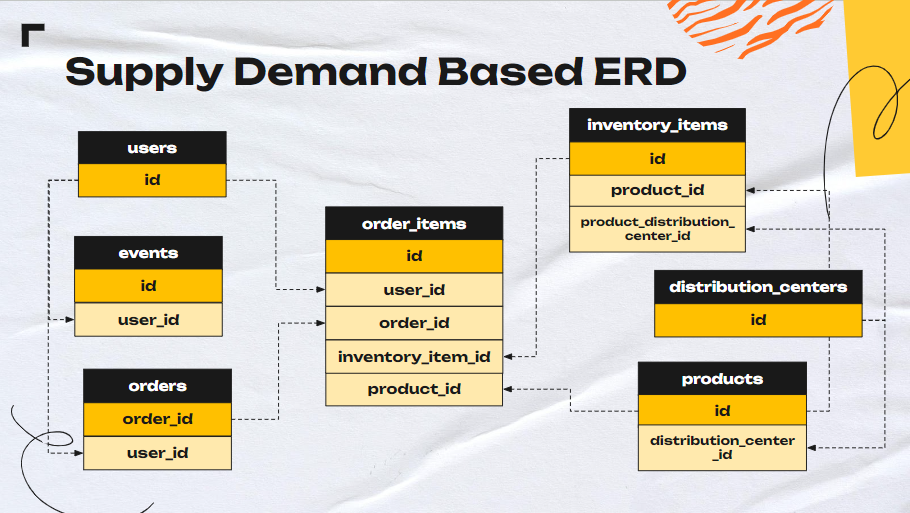
ERD Scheme
 I've made ERD scheme to look how entity related each other. So, we will start our analysis from:
1. Identify categories with the lowest business growth.
SELECT
  p.category,
  SUM(oi.sale_price*o.num_of_item) AS revenue,
  COUNT(o.order_id) AS quantity
FROM `bigquery-public-data.thelook_ecommerce.order_items` AS oi
  LEFT JOIN `bigquery-public-data.thelook_ecommerce.orders` AS o
    ON oi.order_id = o.order_id
  LEFT JOIN `bigquery-public-data.thelook_ecommerce.products` AS p
    ON oi.product_id = p.id
WHERE oi.status NOT IN ('Cancelled', 'Returned')
      AND EXTRACT(YEAR FROM DATE(o.delivered_at)) = 2022
GROUP BY 1
ORDER BY 3 DESC;
Query Result
Clothings sets and Jumpsuit & Rompers are the top 20% lowest order percentile followed with small proportion of revenue.
2. Calculate monthly growth of inventory in percentage by product categories.
WITH monthly_inventory AS (
  SELECT DISTINCT(product_category),
         DATE_TRUNC(DATE(created_at), MONTH) AS month,
         COUNT(DISTINCT id) AS inventory_count
  FROM `sql-project-376612.thelook_ecommerce.inventory_items`
  GROUP BY month, product_category
),
monthly_growth AS (
  SELECT DISTINCT product_category,
                  month,
                  inventory_count,
                  LAG(inventory_count) OVER (PARTITION BY product_category ORDER BY month) AS previous_count,
                  (inventory_count - LAG(inventory_count) OVER (PARTITION BY product_category ORDER BY month))  AS month_growth
  FROM monthly_inventory
),
SELECT month,
       product_category,
       inventory_count,
       previous_count,
  CASE
    WHEN previous_count > 0 THEN ROUND((month_growth / previous_count) * 100, 2)
    ELSE 0
  END AS growth_percentage
FROM monthly_growth
WHERE month BETWEEN '2022-01-01' AND '2022-12-31'
ORDER BY month DESC; --Order by month descendingly
Query Result
Using standard deviation of monthly growth inventory, we can identify which brand has unstable supply stock, it means these kind of category product relatively has low market share and market demand. From the spreadsheet, clothing sets, suits, and Jumpsuit & rompers are top 3 categories that has unstable growth of inventory.
3. Create monthly user retention cohorts.
WITH cte_l AS (
SELECT DISTINCT user_id AS userid,
               MIN(DATE_TRUNC(DATE(created_at), MONTH)) OVER(PARTITION BY user_id) AS first_purchase_date,
               DATE_TRUNC(DATE(created_at), MONTH) AS running_purchase_date
FROM `sql-project-376612.thelook_ecommerce.orders`
WHERE status = ‘Complete’ –order arrived, no complaints/return = complete orders
),
cte_2 AS (
SELECT * ,
               DATE_DIFF(running_purchase_date, first_purchase_date, MONTH) AS diff_month,
               COUNT(DISTINCT userid) OVER(PARTITION BY first_purchase_date) AS cohort_size
FROM cte_l
),

cte_3 AS (
SELECT first_purchase_date, diff_month AS month, cohort_size,
       COUNT(DISTINCT userid) AS total_user
FROM cte_2
WHERE first_purchase_date BETWEEN '2022-01-01' AND '2022-12-31'
GROUP BY 1, 2, 3
ORDER BY 1, 2, 3
)
SELECT *, total_user/cohort_size AS total_user_perc
FROM cte_3
Query Result
Cohort shows thelook e-commerce suffers extreme drop on monthly cohort at M+1. After one month of purchase, thelook e-commerce already lost 97-98% of their previous customers, leaving 1-3% in the next month.
Result Slide Deck
Attachments
» Dataset Link « | » Spreadsheet Link « | » Big Query Link «
I’m grateful you took the time to explore my portfolio site and view my work. Your interest means a lot.
Feel free to provide any feedback or ask questions - I welcome your thoughts. Thank you again for checking out my projects and considering my skills. I appreciate you taking the time to do so.
