
Situation
As data analyst in Samba Commerce, the CEO ask me to make dashboard to capture and understand more metrics and make the business data more comprehensive and insightful.
Backround
You are a data analyst at one of the fast growing ecommerce in Brazil named Samba Commerce, which just launched in 2021. Samba Commerce offers more than 15k products, and more than 50 product categories to the customers all over Brazil. There are a number of internal and external variables that support our business growth. We want to utilize more data to support our growth in 2022.
Mr. Ronaldinho (CEO), requested Mr Neymar (head of data) to create a company wide dashboard. Mr Neymar trust you to create the dashboard.
“Olá, as per my explanation in our Analytics town hall our Company’s main OKR (Objectives and Key Results) this year is about transactions. So Mr. CEO requested a dashboard for company-wide to understand our business performance better. The bigger picture is there in our current dashboard, I need your help to capture more metrics and revamp our dashboard to be more comprehensive and insightful.”
Problem Definition
Samba Commerce aims to solve the problem of lacking a centralized platform for monitoring and analyzing crucial business metrics. Without a dashboard solution, Samba Commerce acknowledges that stakeholders and decision-makers may struggle to access a comprehensive view of key performance indicators (KPIs), potentially resulting in time-consuming data analysis and misalignment among team members and stakeholders.
Objective
This project aims to create executive and operational dashboards that offer a unified display of critical business metrics. These dashboards will empower stakeholders to oversee business performance, detect trends, analyze data, and make informed choices. The objective is to improve comprehension, productivity, and teamwork by delivering a visual and interactive platform for exploring, analyzing, and communicating data.
- Who
- The dashboard will be used by various stakeholders within the company, including executives, managers, and analysts.
- Why
- The dashboard provides them with the data they need to get insights about the company’s performance.
Task & Action
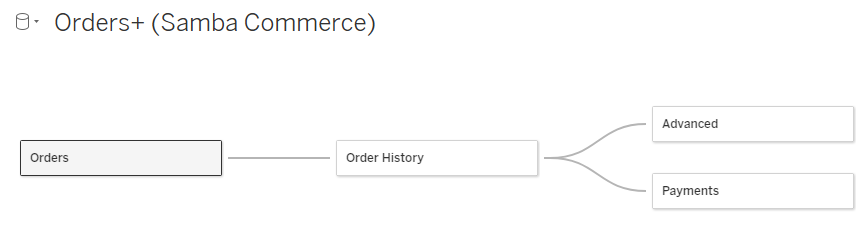
- First thing, we upload the data source into looker/tableau based on Samba Commerce dataset.
- Next, we connect related variable between sheets (same as ERD join function in SQL).
Dashboard UI
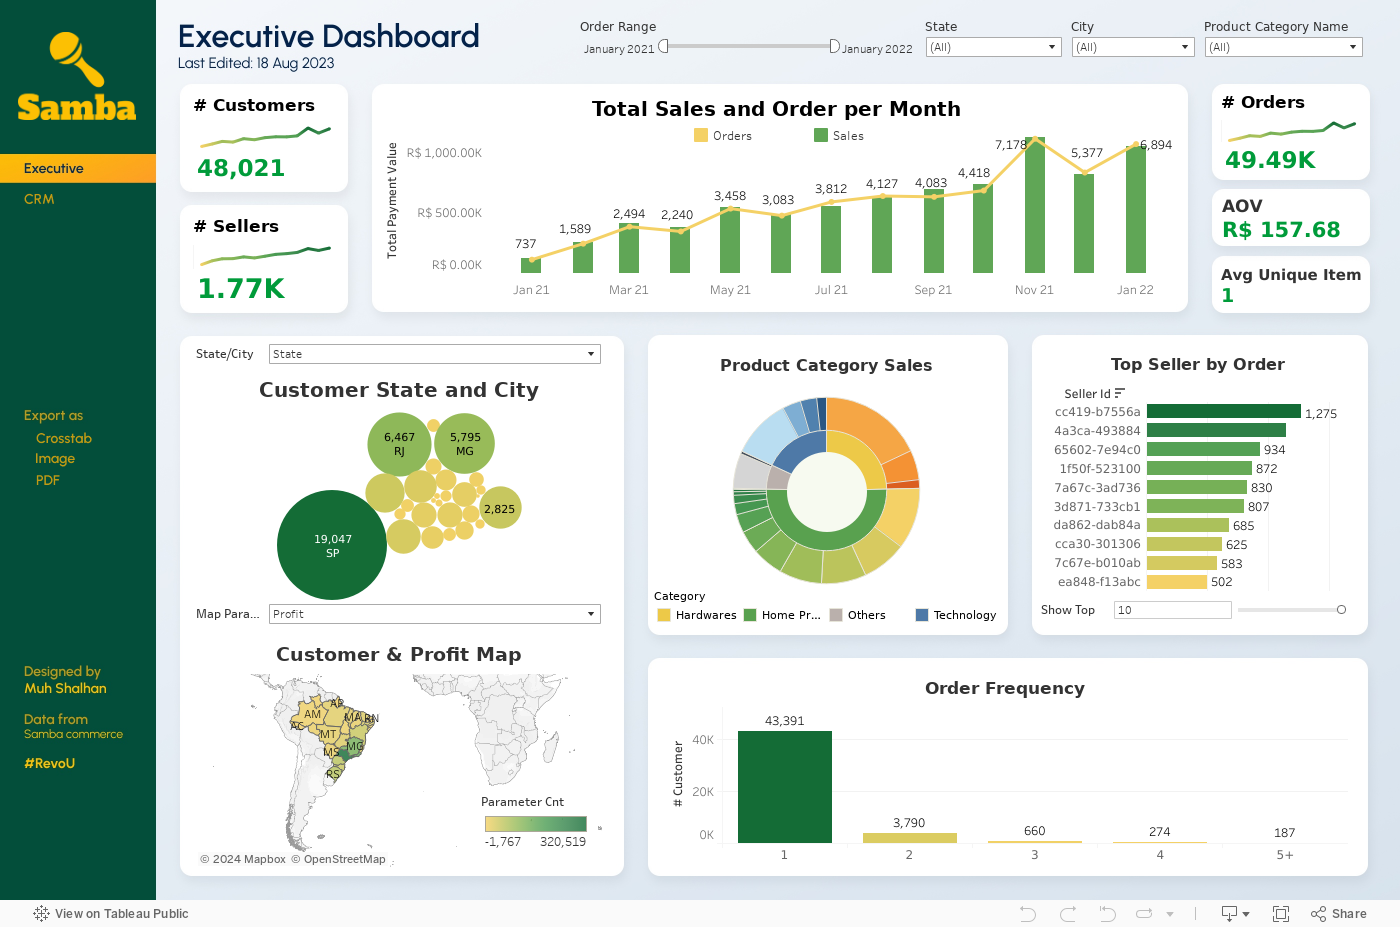
We create 3 menus for this dashboard :
- Executive Dashboard
- CRM Dashboard + Extra view
Now, here’s the view of CRM Dashboard

Another version Looker Studio
Result - Deck
Attachments
» Dataset Link « | » Tableau Link « | » Looker Link «
I’m grateful you took the time to explore my portfolio site and view my work. Your interest means a lot.
Feel free to provide any feedback or ask questions - I welcome your thoughts. Thank you again for checking out my projects and considering my skills. I appreciate you taking the time to do so.
» Let’s get in touch on LinkedIn! « | » Visit my Tableau Profile! «